When Bonds Stop Hedging Stocks
For two decades, a balanced portfolio came with a built-in shock absorber. When stocks fell, Treasury bonds usually rose, so the bonds in a 60/40 portfolio paid off when they were most needed. That is no longer true. Over the five years ending in December 2025, the correlation between the monthly excess returns of a 10-year Treasury zero-coupon bond and of the stock market was 0.54, the highest since 1995.
Practitioners have noticed. The Financial Times Unhedged newsletter asks whether the 60/40 portfolio is dead (Kim 2026). Simon White of Bloomberg writes that the 60/40 portfolio is “caught in an inflation trap” (White 2026). Goldman Sachs Research finds that the best allocation to bonds over the last five years was close to zero (Goldman Sachs 2026). Vanguard argues that correlation matters less than investors think (Vanguard 2026), and AQR calls the positive correlation “a terrible reason to add more equity risk to your portfolio” (Villalon and Ilmanen 2026).
This post uses the data of The Term Structure in the Data, a chapter of my Investments notes, to sort out what changed, why, and what it means for investors. The short answer: what changed is not expected inflation but how real rates move with stocks, and bonds became a worse hedge and, for the same reason, a better investment.
Fifty Years of the Stock-Bond Correlation
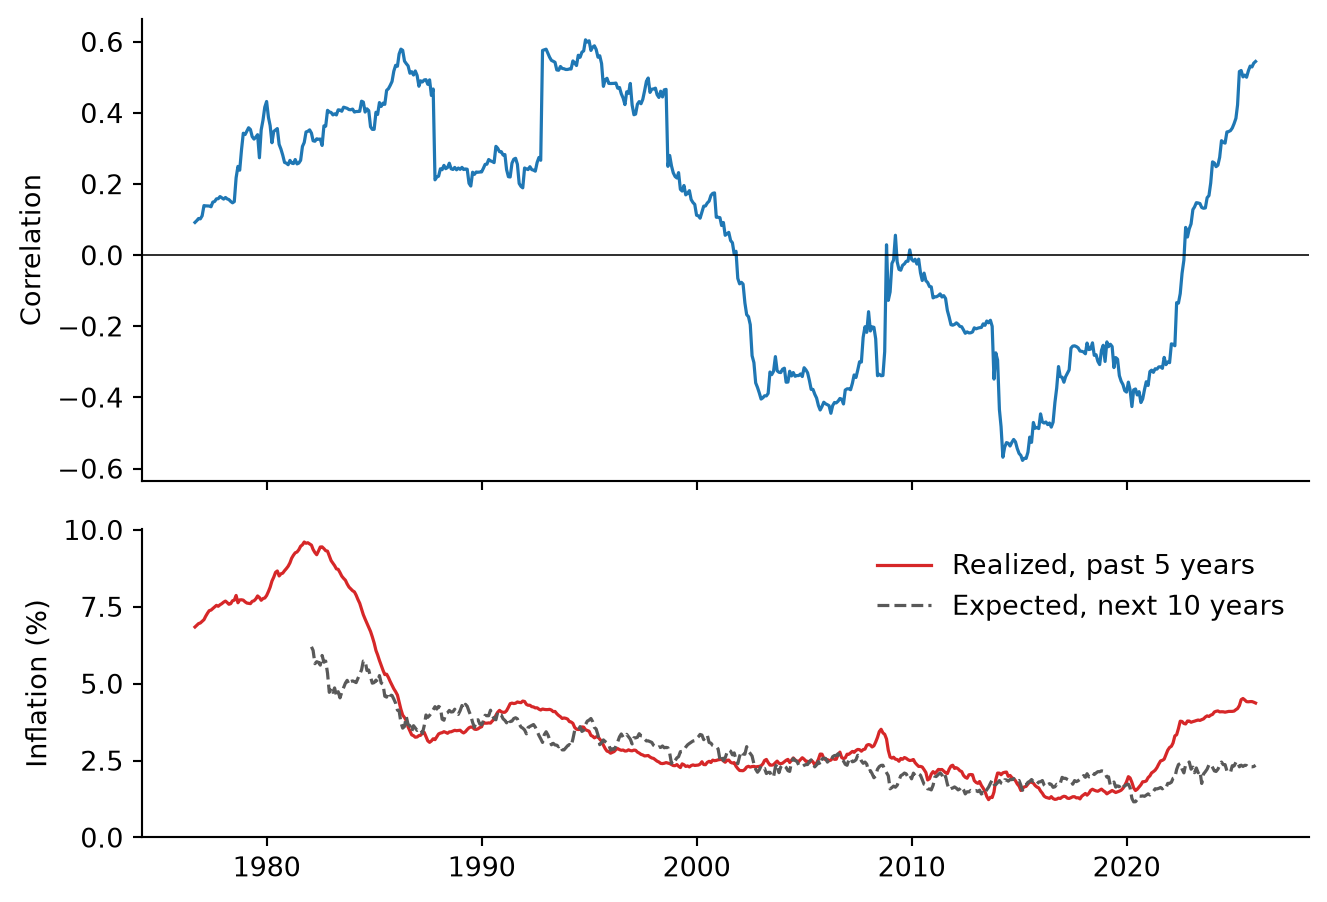
Figure 1 shows three regimes. The correlation was positive from the 1970s through the 1990s, negative, apart from a few months in 2008 and 2009, from late 2001 until September 2022, and positive since. The negative stretch, the one most of today’s portfolio managers learned the business in, is the exception: AQR notes that the correlation was more often positive than negative from 1900 to 2000 (Villalon and Ilmanen 2026).
Why the Sign Flips
Stocks and bonds respond to two kinds of news. News about growth moves them in opposite directions: a weaker economy lowers expected earnings, and with them stock prices, and it lowers expected short rates, which raises bond prices. News about inflation moves them in the same direction: higher inflation erodes the real value of bond payments and leads the central bank to raise rates, which hurts stocks as well. So does any news that raises real interest rates, whatever its source, because it raises the discount rate on both. The sign of the correlation depends on which kind of news dominates.
Campbell et al. (2017) describe bonds as “deflation hedges” when growth news dominates and “inflation bets” when inflation news dominates. Campbell et al. (2020) date the switch to around 2001, when the correlation between inflation and the output gap turned from negative, as in a supply shock, to positive, as in a demand shock. Pflueger (2025) adds monetary policy: bonds and stocks move together when supply shocks are volatile and the Federal Reserve responds strongly to inflation, as in the 1980s.
White adds a threshold. He finds that the correlation has almost always been positive when the 10-year yield is above 5.25%, and when core PCE inflation is above 3%, the level above which, he argues, inflation starts feeding on itself. The data in Figure 1 agree with the broad pattern: the rolling correlation was positive in 98% of the months in which the 10-year yield was above 5.25% and in only 18% of the others. But the split is mostly a split between two eras, high yields before 2000 and low yields after, and the most recent data do not fit it. In 2025 the 10-year yield averaged 4.29%, well below the threshold, and the correlation reached 0.54.
White himself says that inflation, not yields, drives the relationship, but the level of inflation is not the whole story either. In the bottom panel of Figure 1, average inflation was about the same in the windows ending from 1998 to 2000 and from 2002 to 2006, 2.4% and 2.5%, yet the correlation averaged 0.23 in the first and -0.35 in the second. What changed in 2001 was not how high inflation was but whether it rose in good times or in bad times, the switch that Campbell et al. (2020) date to that year.
Real Rates, Not Expected Inflation
The dashed line in Figure 1 shows something the realized inflation line hides. The Cleveland Fed’s estimate of inflation over the next ten years averaged 2.34% in 2025, about where it was from 2003 to 2007, 2.40%, when the correlation was strongly negative. Long-run expectations stayed anchored while the correlation flipped. So what moved bond prices? A 10-year nominal Treasury yield is the sum of the real yield, at which inflation-protected Treasuries trade, and the breakeven inflation rate, the difference between the two, which measures expected inflation plus a premium for inflation risk. Table 1 splits the monthly changes in the 10-year yield into these two parts and asks which one moves with stocks.
| Nominal yield | Breakeven | Real yield | Real yield share (%) | |
|---|---|---|---|---|
| 2010 to 2019 | 0.49 | 0.66 | 0.07 | 60 |
| 2021 to 2025 | -0.54 | 0.25 | -0.69 | 84 |
In the 2010s, the hedge worked through inflation expectations. When stocks fell, breakevens fell with them as investors priced lower inflation, nominal yields dropped and bonds rallied, while changes in real yields were unrelated to stock returns, with a correlation of 0.07. Since 2021, the real yield has done most of the moving, 84% of the variance, and it rises when stocks fall, with a correlation of -0.69.
From December 2020 to December 2025, the 10-year yield rose from 0.93% to 4.18% while the breakeven moved only from 1.99% to 2.25%, so the real yield went from -1.06% to 1.93%. A higher real rate raises the discount rate on every asset, so stocks and bonds fall together. Government debt is a claim on future taxes and stocks a claim on future profits, so when both lose value at once the shock is economy-wide. Neither asset hedges the other, and investors as a whole cannot get rid of the risk, so they must be paid to bear it, which is where the higher term premium below comes from.
What pushes real rates up when stocks fall? There are two candidates, and these data cannot separate them. The first is monetary policy. With inflation above target, the Federal Reserve cannot cut rates when stocks fall, and hawkish surprises raise real rates and hurt both assets. This is the mechanism of Pflueger (2025), and the point White and Goldman Sachs make about a Fed with less room to cut.
The second is the real term premium. Deficits, borrowing by the AI hyperscalers and doubts about the independence of the Fed under Kevin Warsh, three of the explanations the Financial Times collects (Kim 2026), raise the compensation investors demand for holding long-term bonds, which lifts long real yields and lowers stock prices as well.
The fiscal theory of the price level gives this second candidate a natural home. In Cochrane (2023), government debt is valued like a stock, as the present value of future surpluses, and discount rates are “the central story for disinflation in recessions”: in bad times investors flee to government debt, which is the negative bond beta of the 2000s and 2010s in fiscal language. Cochrane warns that this “is not written in stone,” and that doubts about sovereign debt “could rapidly change the return investors require to roll over that debt” (Cochrane 2023, 110, 193). A higher required return on government debt lowers the value of bonds and, through the same discount rate, the value of stocks, with no change in expected inflation.
Either way, inflation matters through the Fed and through the premium on long bonds, not through expected inflation itself. The split is approximate, because the breakeven also contains an inflation risk premium and a liquidity premium on TIPS, and five years of monthly data show what moved together, not what caused what.
What It Does to a 60/40 Portfolio
Table 2 compares the three regimes. In the last five years, the volatility of a 60/40 portfolio of the stock market and the 10-year zero was 11.8%, against 9.2% from 2000 to 2020. That is a real loss: the same portfolio carries 29% more risk.
| Bond correlation | Bond beta | 60/40 volatility (%) | 60/40 correlation | |
|---|---|---|---|---|
| 1971 to 1999 | 0.29 | 0.23 | 11.92 | 0.92 |
| 2000 to 2020 | -0.28 | -0.16 | 9.17 | 0.93 |
| 2021 to 2025 | 0.54 | 0.35 | 11.85 | 0.96 |
Two numbers in the table put the loss in perspective. The first is the last column. A 60/40 portfolio was dominated by stocks in every regime, with a correlation with the stock market of 0.92 to 0.96. This is AQR’s point: investors did not acquire a diversification problem in 2022, they always had one.
The second is the bond’s beta. From 2021 to 2025, each dollar in the 10-year bond came with 35 cents of stock market exposure, after 16 cents of negative exposure from 2000 to 2020. That is worse, but it is still a small number (AQR finds 0.19 for a Treasury index, which has a shorter duration than the 10-year zero). The usual replacements proposed for bonds carry much more: AQR estimates five-year betas of 0.70 for private credit, 0.63 for buffer funds and 2.09 for bitcoin. An investor who sells bonds because they no longer diversify, and buys one of these, ends up less diversified.
Nor have bonds stopped lowering risk. With a correlation below one, the 60/40 volatility of 11.8% is still below the 13.2% weighted average of the stock and bond volatilities.
What a hedge has to do is pay off in a sell-off, which a five-year correlation mixes with normal times. Matt Rowe of Man Group, quoted in the Financial Times, draws this distinction between crisis and non-crisis correlation, and adds that “there’s a lot of people who don’t think that a long Treasury position is going to save them in a risk-off” (Kim 2026). The record is better than that fear suggests: Vanguard finds that from 1990 to April 2023, global bonds cushioned every equity drawdown of more than 10% except the one in 2022, including the drawdowns in which the monthly correlation was positive.
The Price of a Hedge
Most of the commentary stops at risk, but the more interesting change is in expected returns. An asset that pays off in bad times is valuable, and investors pay for that with a lower expected return. When bonds hedged stocks, investors accepted a negative term premium: the estimate of the term premium in the 10-year yield from the model of Adrian et al. (2013), published by the New York Fed, reached -1.38% in July 2020, meaning investors expected to earn less on 10-year bonds than on rolling short-term bills. As bonds stopped hedging, the premium came back, to 0.75% at the end of 2025.
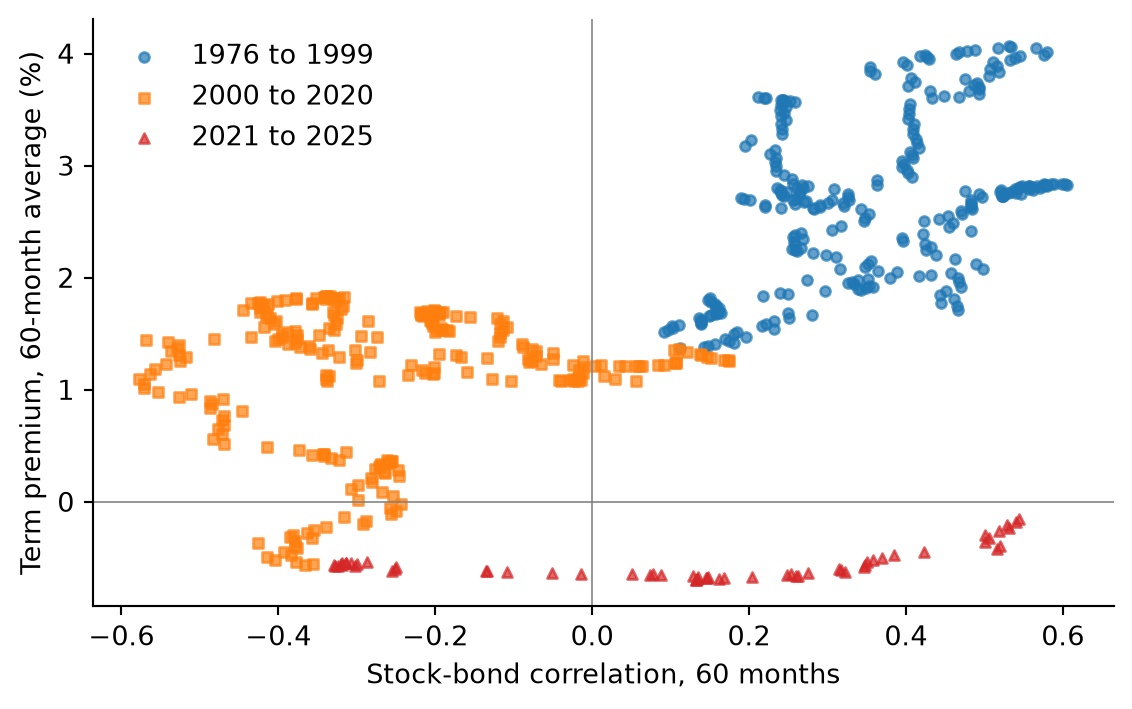
Figure 2 shows that this is not just a recent coincidence. Across the whole sample, five-year windows with a higher stock-bond correlation had a higher average term premium; the correlation between the two series is 0.56. In the model of Campbell et al. (2017), this is what should happen: the term premium is high when bonds are inflation bets and low when they are deflation hedges. The latest windows have so far moved right more than up, because their five-year averages still include the negative premia of 2021 to 2023.
This changes how to read White’s warning that the positive correlation is self-reinforcing: less hedging demand for Treasuries, lower liquidity, a higher term premium, higher yields. The steps are right, but the end of the chain is not a failure of the market. A higher term premium is the price at which someone is willing to hold the duration that hedgers no longer want. An investor who sells bonds because they no longer hedge sells them cheaper, to an investor who collects the higher premium. Goldman Sachs Research notes that the 10-year yield, at 5.3% in October 2026, is above its average of 4.7% over the last 250 years, “not a bad starting point for long-run investing in bonds.”
Two cautions apply. Term premium estimates depend on the model that produces them, and they differ across models, so the level of 0.75% should not be taken literally. And Figure 2 does not say that the correlation causes the premium: both respond to the same shocks.
What Should an Investor Do?
It depends on what the bonds are for. An investor who holds Treasuries to cushion stock market losses has lost much of that cushion, at least while real rates rise in sell-offs, and no reshuffling of long positions brings it back. An investor who holds them for their expected return is in a better position than at any time since 2014. Goldman Sachs Research frames this as a matter of horizon: over the next few months it prefers stocks, but “the longer your investment horizon gets, the more you need to think about a more normal allocation to bonds.”
For the hedging investor, the lesson from the economics is to hedge the risk that is actually there, and since 2021 that risk has been real rates rising when stocks fall. Inflation-protected Treasuries, which Goldman Sachs Research recommends for inflation protection, do not hedge it: their yields are the real yields that rose. Shorter maturities carry less of the risk, and Goldman sees more value in short- to medium-term government debt, which yields nearly as much as longer-term bonds. Both Goldman and AQR also point to trend-following strategies, which can be short bonds while yields rise and which AQR finds had a slightly negative beta on stocks over the last five years. What does not follow is to replace bonds with more equity risk.
Whether the correlation stays positive is an open question. AQR and Goldman Sachs expect it to turn negative again if inflation settles; White expects it to stay positive while core inflation is above 3%. In the terms of this post, the answer depends less on inflation itself than on whether the Fed regains room to cut rates in a sell-off, and on the return investors demand for holding long-term government debt. I don’t know which will happen. What the data do say is that the market has already repriced the loss of the hedge. Bonds are a worse hedge than they were in the 2010s and a better investment, and which of the two matters depends on why one holds them.
I write these posts to explain ideas in finance that I find interesting. This post is not investment advice.