Automated Market Makers
Stock exchanges match buyers and sellers in an order book, where traders post the prices at which they are willing to trade. Running an order book on a blockchain is expensive, because every new order, change and cancellation is a transaction that someone pays to record. Decentralized exchanges solved this with a different design: a pool of two tokens that quotes prices from a formula. Anyone can trade against the pool, and anyone can supply it with tokens. This chapter explains how such an automated market maker sets prices, how arbitrage keeps its prices in line with the rest of the market, and what the investors who supply its tokens earn and lose.
A pool and a formula
An automated market maker holds reserves of two tokens, say x units of ether (ETH) and y units of a dollar stablecoin (USDC). The investors who deposit the tokens are liquidity providers, and they own the pool in proportion to their deposits. The pool trades with anyone, following one rule. In the design of Uniswap, the most widely used decentralized exchange, the rule is that trades must keep the product of the reserves constant (Adams et al. 2020): x \, y = k. \tag{1} The pool’s price of ETH in USDC is the ratio of the reserves, P = y/x. A trader who buys ETH takes ETH out of the pool and puts USDC in; to keep the product fixed, each additional ETH costs more USDC than the last. If a trader buys \Delta x ETH, the pool’s reserves move to x - \Delta x and k/(x - \Delta x), so the trader pays \Delta y = \frac{k}{x - \Delta x} - y = y \, \frac{\Delta x}{x - \Delta x} \tag{2} USDC, before fees. The average price paid, \Delta y/\Delta x = y/(x - \Delta x), rises with the size of the trade relative to the pool. That rise is the pool’s price impact, the counterpart of walking up an order book. A pool with larger reserves gives smaller price impact for the same trade, which is why liquidity providers’ deposits are valuable to traders.
Each trade also pays a fee, 0.30% of the amount traded in Uniswap’s original pools, which stays in the pool and accrues to the liquidity providers.
Arbitrage keeps the price in line
The pool does not look at the price of ETH anywhere else. When the price moves on other exchanges, the pool’s price is stale until someone trades with it. Arbitrageurs do: when ETH rises elsewhere, they buy it cheaply from the pool until the pool’s price y/x has caught up, and when ETH falls they sell it to the pool. Ignoring fees, after each move the pool’s reserves satisfy both xy = k and y/x = P, the market price, which pins them down: x = \sqrt{k/P}, \qquad y = \sqrt{k P}. \tag{3} The pool is then worth V = Px + y = 2\sqrt{kP}, half in each token. With a fee, arbitrageurs trade only when the gap between the two prices is larger than the fee, so the pool’s price stays within a narrow band around the market price.
Arbitrage makes the pool’s price track the market, which is what makes the pool useful. But arbitrageurs profit at the pool’s expense: they buy ETH from the pool just after its price has risen elsewhere and sell ETH to the pool just after its price has fallen, always trading against prices the pool has not yet updated. In market-making language, the pool is adversely selected. Liquidity providers are paid by the fees from all traders and lose to the arbitrageurs.
What liquidity providers earn and lose
The popular measure of the loss is impermanent loss: the value of the pool position compared with simply holding the tokens deposited. If the price moves from P_0 to P_1 = r P_0, the pool position’s value grows by a factor \sqrt{r}, by (3), while holding the original tokens, half in each, grows by a factor (1 + r)/2. The ratio of the two, minus one, is \text{IL}(r) = \frac{2\sqrt{r}}{1 + r} - 1 \le 0. \tag{4} It is called impermanent because it disappears if the price returns to where it started.
Milionis et al. (2022) argue that this is a poor way to measure what liquidity providers lose. Its value depends on the arbitrary date chosen as the start, and it mixes the loss to arbitrageurs with a difference in exposure to ETH: the pool sells ETH as its price rises, while a holder keeps all of it. They propose instead to compare the pool with a portfolio that makes the same trades as the pool, but at market prices. Suppose the market price moves to 3,020 and arbitrageurs buy 1 ETH from the pool at an average of 3,010. The benchmark portfolio sells the same 1 ETH at 3,020. The 10 dollars of difference is the pool’s loss versus rebalancing: exactly what it gives up by trading at stale prices. For a constant-product pool it has a remarkably simple form: per unit of time, the loss is a fraction \frac{\text{LVR}}{V} = \frac{\sigma^2}{8} \tag{5} of the pool’s value, where \sigma^2 is the variance of ETH’s return per unit of time. As they put it, with losses in basis points (hundredths of a percent), “if the ETH-USDC volatility is \sigma = 5\% (daily), this formula implies that the ETH-USDC LP pool loses approximately \sigma^2/8 = 3.125 (bp) in pool value to LVR daily.”
The economics is now a comparison of two rates. A pool earns fees at a rate that depends on how much is traded relative to the pool’s size, and loses to arbitrageurs at a rate that depends on volatility. Supplying liquidity pays when fees exceed \sigma^2/8. Lehar and Parlour (2025) show how this works out in equilibrium: liquidity flows into a pool or out of it until “liquidity suppliers trade off potential adverse selection against fee revenue.”
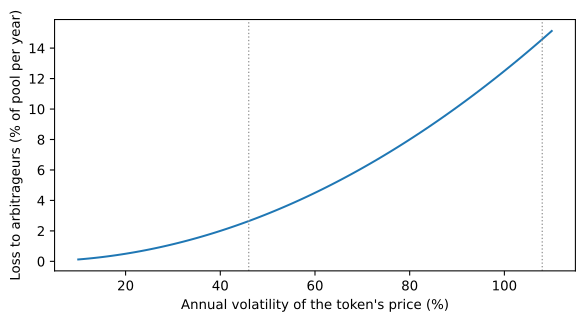
Figure 1 puts the formula in annual terms, using \sigma^2 per year. Since 2018, the annual volatility of ETH’s price has ranged from about 46%, in 2023, to about 108%, in 2018 and 2021, which costs a pool like Uniswap’s, which spreads its liquidity over all prices, between about 2.6% and 14.6% of its value per year. A pool whose fees bring in less than that does worse for its liquidity providers than a portfolio with the same exposure to ETH, even if both make money in a rising market.
Concentrated liquidity
In 2021 Uniswap’s third version let liquidity providers place their tokens in a chosen price range instead of along the whole curve (Adams et al. 2021). Inside the range the position behaves like a much larger constant-product pool, so it earns more fees per dollar deposited; outside the range it earns nothing and holds only one of the two tokens. Concentrating liquidity raises both the fee rate and the loss to arbitrageurs per dollar, and turns supplying liquidity into an active job of choosing and moving ranges.
Practice Problems
These problems give you a chance to practice the concepts introduced in this chapter. Try to solve each one on your own before expanding the solution.
Problem 1 (Price Impact) A pool holds 1,000 ETH and 3,000,000 USDC. What is its price of ETH? Ignoring fees, how much does a trader pay to buy 10 ETH, and to buy 100 ETH? What is the average price per ETH in each case?
Solution
The pool’s price is 3{,}000{,}000/1{,}000 = 3{,}000 USDC per ETH, and k = 3 \times 10^9. By (2), buying 10 ETH costs 3{,}000{,}000 \times 10/990 \approx 30{,}303 USDC, an average of about 3,030 per ETH, 1% above the pool’s price. Buying 100 ETH costs 3{,}000{,}000 \times 100/900 \approx 333{,}333 USDC, an average of about 3,333 per ETH, 11% above. The larger the trade relative to the pool, the larger the price impact.Problem 2 (Impermanent Loss) A liquidity provider deposits into an ETH-USDC pool when ETH trades at 2,000. Using (4), what is the impermanent loss if ETH rises to 8,000? If it then falls back to 2,000? What does this say about impermanent loss as a measure of what the liquidity provider lost?
Solution
At 8,000 the price ratio is r = 4, so \text{IL} = 2 \times 2/(1 + 4) - 1 = -20\%: the position is worth 20% less than holding the original tokens. If the price returns to 2,000, r = 1 and \text{IL} = 0. But arbitrageurs traded against the pool on the way up and on the way down, and the fees earned are the only thing that compensated for it. Impermanent loss measures only where the price ended relative to the start date, not the loss along the way, which is the point of Milionis et al. (2022).Problem 3 (Is the Pool Worth It?) A token’s daily volatility is 4%. A pool trading it earns fees equal to 2.5 basis points of its value per day. Using (5), do liquidity providers come out ahead? What daily volatility would make fees and losses equal?