from pathlib import Path

import matplotlib.pyplot as plt
import pandas as pd
import requests

DATA = Path("../_data") if Path("../_data").exists() else Path("data")

def blockchain_chart(name):
    file = DATA / f"blockchain_{name}.parquet"
    if not file.exists():
        url = f"https://api.blockchain.info/charts/{name}?timespan=all&sampled=false&format=json"
        response = requests.get(url, headers={"User-Agent": "FIN 4506 course notebook"},
                                timeout=60)
        response.raise_for_status()   # stop with a clear error if the site refuses
        values = response.json()["values"]
        series = pd.Series([v["y"] for v in values],
                           index=pd.to_datetime([v["x"] for v in values], unit="s"))
        DATA.mkdir(exist_ok=True)
        series.groupby(series.index.normalize()).mean().rename(name).to_frame().to_parquet(file)
return pd.read_parquet(file)[name]Mining Economics
Bitcoin miners are paid in newly created bitcoin and in transaction fees, and roughly every four years the protocol halves the new bitcoin in each block. This notebook uses daily data on the Bitcoin network since 2012 to see what the halvings do to miners’ revenue and to the computing power securing the network, how much of miners’ pay comes from fees, and how large the budget for security is compared with the value it protects. The notes on hashing and proof of work explain the background.
Packages and data
The charts on Blockchain.com can be downloaded through a free interface without an account. The function below downloads one chart’s full daily history and caches it. Some charts are recorded several times a day, so we average them by calendar day.
We need four daily series: miners’ total revenue in dollars, the part of it that comes from fees, the network’s hash rate in trillions of hashes per second (TH/s), and Bitcoin’s market value.
btc = pd.concat([blockchain_chart(name) for name in
                 ["miners-revenue", "transaction-fees-usd", "hash-rate", "market-cap"]],
                axis=1, sort=True).dropna().loc["2012":]
btc.columns = ["revenue", "fees", "hash_rate", "market_cap"]
btc["hash_rate"] = btc["hash_rate"] / 1e6   # exahashes per second (EH/s)
btc.tail()| revenue | fees | hash_rate | market_cap | |
|---|---|---|---|---|
| 2026-11-06 | 3.393311e+07 | 254612.219122 | 1003.032957 | 1.526435e+12 |
| 2026-11-07 | 3.341389e+07 | 207958.772954 | 988.282472 | 1.526131e+12 |
| 2026-11-08 | 2.652714e+07 | 241664.701886 | 818.651899 | 1.525590e+12 |
| 2026-11-09 | 2.893773e+07 | 218800.752191 | 818.651899 | 1.501877e+12 |
| 2026-11-10 | 3.201645e+07 | 215287.755424 | 995.657715 | 1.493681e+12 |
The four halvings so far:
halvings = pd.to_datetime(["2012-11-28", "2016-07-09", "2020-05-11", "2024-04-20"])The computing power securing the network
fig, ax = plt.subplots(figsize=(8, 3.5))
btc["hash_rate"].plot(ax=ax, logy=True, lw=0.8)
for h in halvings:
    ax.axvline(h, color="0.5", ls=":", lw=1)
ax.set_xlabel("")
ax.set_ylabel("Hash rate (EH/s, log scale)")
ax.set_title("Bitcoin hash rate, with the halvings")
plt.show()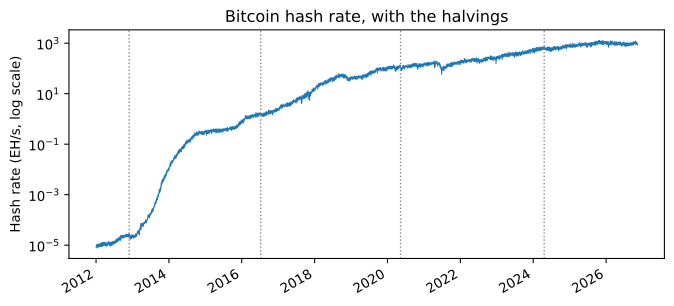
The hash rate has grown by many orders of magnitude, as mining moved from ordinary computers to chips built for nothing but SHA-256. Bitcoin’s difficulty adjustment absorbs that growth: more computing power makes blocks harder to find, so a block still arrives about every ten minutes.
What a halving does
Compare the 30 days before each halving with the 30 days after.
rows = []
for h in halvings:
    before = btc.loc[h - pd.Timedelta(days=30):h - pd.Timedelta(days=1)].mean()
    after = btc.loc[h + pd.Timedelta(days=1):h + pd.Timedelta(days=30)].mean()
    rows.append({"halving": h.date(),
                 "revenue": after["revenue"] / before["revenue"] - 1,
                 "hash rate": after["hash_rate"] / before["hash_rate"] - 1})
pd.DataFrame(rows).set_index("halving").style.format("{:+.0%}")| revenue | hash rate | |
|---|---|---|
| halving | ||
| 2012-11-28 | -50% | -8% |
| 2016-07-09 | -54% | -1% |
| 2020-05-11 | -41% | -12% |
| 2024-04-20 | -49% | -2% |
Each halving cut miners’ revenue in dollars by roughly 40% to 55% over the following month, while the hash rate fell by 12% at most, and by 2% or less in 2016 and 2024. Mining equipment is a sunk cost, and a miner keeps running a machine as long as its revenue covers the electricity. Over the following months, the least efficient machines are switched off, new and more efficient ones arrive, and the price of bitcoin moves, which is why the halvings show up as pauses in the hash rate’s growth rather than as collapses.
Revenue per unit of computing power
Divide miners’ daily revenue by the hash rate and you get what one unit of computing power earns per day, which miners call the hashprice.
btc["hashprice"] = btc["revenue"] / btc["hash_rate"]

fig, ax = plt.subplots(figsize=(8, 3.5))
btc["hashprice"].loc["2014":].plot(ax=ax, logy=True, lw=0.8)
for h in halvings[1:]:
    ax.axvline(h, color="0.5", ls=":", lw=1)
ax.set_xlabel("")
ax.set_ylabel("USD per EH/s per day (log scale)")
ax.set_title("Revenue per unit of computing power")
plt.show()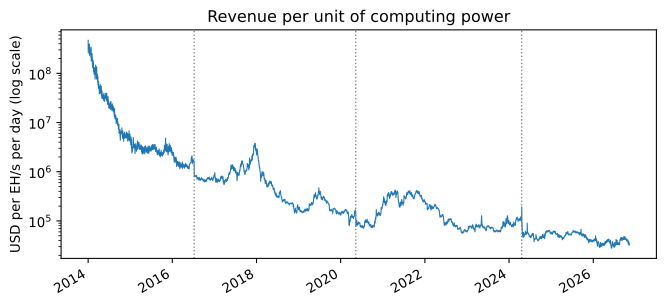
Revenue per unit of computing power falls over time, with large swings when the price of bitcoin moves: competition among miners pushes it toward the cost of producing a hash, and that cost keeps falling as chips improve. Each halving takes another step down. This is why the hashprice says little about security: what an attacker must outspend is the total paid to miners, not the pay per hash.
How much of the pay comes from fees?
fee_share = (btc["fees"] / btc["revenue"]).resample("ME").mean()

fig, ax = plt.subplots(figsize=(8, 3))
(100 * fee_share).plot(ax=ax, lw=1)
ax.set_xlabel("")
ax.set_ylabel("Fees (% of revenue)")
ax.set_title("Transaction fees as a share of miner revenue, monthly average")
plt.show()

top = (btc["fees"] / btc["revenue"]).nlargest(1)
print(f"Highest daily share: {top.iloc[0]:.0%} on {top.index[0]:%B %d, %Y}")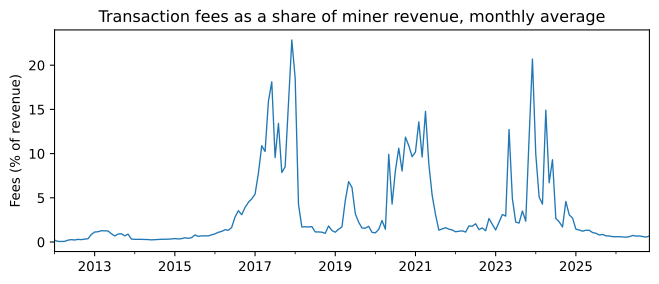
Highest daily share: 75% on April 20, 2024Fees are a small part of miners’ pay: for most of Bitcoin’s history, newly created bitcoin has paid for nearly all of it. Fees spike when blocks are congested and users bid to get their payments in, as on the day of the 2024 halving, but those spikes do not last.
The security budget
Budish (2025) argues that the payments to miners must be large relative to what an attacker could gain. A simple way to track this is to annualize miners’ revenue and compare it with Bitcoin’s market value, the value the security protects.
budget = (365 * btc["revenue"] / btc["market_cap"]).resample("ME").mean()

fig, ax = plt.subplots(figsize=(8, 3.5))
(100 * budget).plot(ax=ax, logy=True, lw=1)
for h in halvings:
    ax.axvline(h, color="0.5", ls=":", lw=1)
ax.set_xlabel("")
ax.set_ylabel("% of market value per year (log scale)")
ax.set_title("Annualized miner revenue relative to Bitcoin's market value")
plt.show()

print((100 * budget).resample("YE").mean().round(2).tail(6).to_string())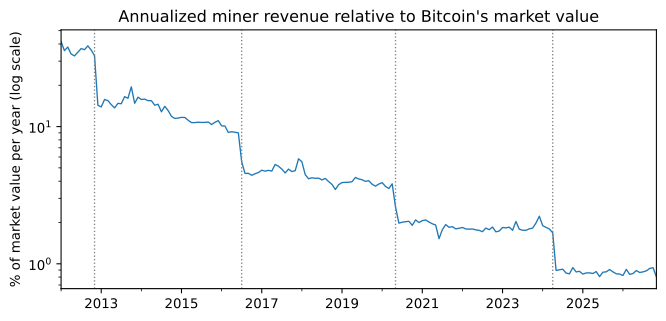
2021-12-31    1.88
2022-12-31    1.78
2023-12-31    1.87
2024-12-31    1.19
2025-12-31    0.86
2026-12-31    0.87
Freq: YE-DEC
The budget has shrunk from about a third of Bitcoin’s value per year in 2012 to under 1%. The shape of the line explains why. Miners’ revenue is the price of bitcoin times the new bitcoin they receive, plus fees; the market value is the price times all the bitcoin in existence. The price cancels, so the ratio is close to the rate at which new bitcoin are created each year, plus a small fee term. That rate is set by the protocol, which is why the line is nearly flat between halvings and drops by about half at each one. Unless fees grow to fill the gap, every halving cuts the payments for security relative to the value they protect, which is the trend Budish (2025) warns about.
Budish, Eric. 2025. “Trust at Scale: The Economic Limits of Cryptocurrencies and Blockchains.” Quarterly Journal of Economics 140 (1): 1–62. https://doi.org/10.1093/qje/qjae033.
Budish’s comparison is per block, not per year: what an attacker must outspend is the flow of payments while the attack lasts, against what the attack could gain. In those terms the budget is small:
latest = btc.iloc[-1]
print(f"Miners' revenue on {btc.index[-1]:%B %d, %Y}: ${latest['revenue'] / 1e6:,.0f} million")
print(f"Market value of all bitcoin:          ${latest['market_cap'] / 1e9:,.0f} billion")
Miners' revenue on November 10, 2026: $32 million
Market value of all bitcoin: $1,494 billionTry it
- Repeat the halving comparison with 90 days before and after instead of 30. Does the hash rate still barely move?
- Plot the price of bitcoin (chart
market-price) on the same graph as the hash rate. Which moves first? - At the next halving, expected in 2028, the new bitcoin in each block falls by half. If the price of bitcoin stayed the same, what share of miners’ revenue would fees have to make up afterwards to keep revenue unchanged? Compare it with the fee shares in the data.